用mathematic绘出下面的动态决策图:
http://slcx.sci.bupt.cn/sxjm/lec/Course12/course12_1.htm
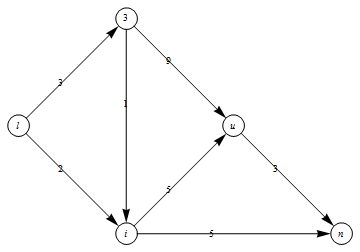
做这个程序时 根据老师的思路 需要大致估计出他们的坐标 列出箭头、文字、圆框的表 然后Graphics 下面给出我自己第一次做的相应程序:
weighArrow[start_, end_, weigh_, r_, pos_] :=
  Module[{st, et, delt = end - start},
   st = start + (r/Norm[delt])*delt;
   et = end - (r/Norm[delt])*delt;
   {Text[weigh, start + delt*pos], Arrow[{st, et}]}
   ];(*带权箭头*)
weigh = {3, 2, 5, 1, 5, 9, 3};
position = {{1, 0}, {2, -1}, {2, 1}, {3, 0}, {4, -1}};
text = {l, i, j, u, n};
road = {{1, 3}, {1, 2}, {2, 4}, {3, 2}, {2, 5}, {3, 4}, {4, 5}};
rr = 0.1;
tempCircle =
  Table[Circle[position[[i]], rr], {i, 1, Length[position]}];
tempText = Table[Text[text[[j]], position[[j]]], {j, 1, Length[text]}];
(*tempArrow=Table[Arrow[{position[[road[[k,1]]]],position[[road[[k,2]]\
]]}],{k,1,Length[road]}];*)
tempArrow =
  Table[weighArrow[position[[road[[k, 1]]]], position[[road[[k, 2]]]],
     weigh[[k]], rr, 0.4], {k, 1, Length[road]}];

helloWorld = Join[tempCircle, tempText, tempArrow];
Graphics[helloWorld]
程序运行结果为:
今天偶然发现 直接用一句代码就可以实现动态决策图的绘制,其代码为:
TreePlot[{{A -> Subscript[B, 1], "4"}, {A -> Subscript[B, 2],
   "3"}, {A -> Subscript[B, 3],
   "5"}, {Subscript[B, 1] -> Subscript[C, 1],
   "5"}, {Subscript[B, 1] -> Subscript[C, 2],
   "4"}, {Subscript[B, 2] -> Subscript[C, 1],
   "7"}, {Subscript[B, 2] -> Subscript[C, 2],
   "6"}, {Subscript[B, 2] -> Subscript[C, 3],
   "5"}, {Subscript[B, 2] -> Subscript[C, 4],
   "3"}, {Subscript[B, 3] -> Subscript[C, 1],
   "5"}, {Subscript[B, 3] -> Subscript[C, 3],
   "2"}, {Subscript[B, 3] -> Subscript[C, 4],
   "2"}, {Subscript[C, 1] -> Subscript[D, 1],
   "2"}, {Subscript[C, 1] -> Subscript[D, 2],
   "5"}, {Subscript[C, 2] -> Subscript[D, 1],
   "6"}, {Subscript[C, 2] -> Subscript[D, 2],
   "3"}, {Subscript[C, 3] -> Subscript[D, 1],
   "2"}, {Subscript[C, 3] -> Subscript[D, 2],
   "1"}, {Subscript[C, 4] -> Subscript[D, 2],
   "7"}, {Subscript[D, 1] -> E, "3"}, {Subscript[D, 2] -> E,
   "5"}}, Left, A, DirectedEdges -> True, VertexLabeling -> True]
绘图结果为:
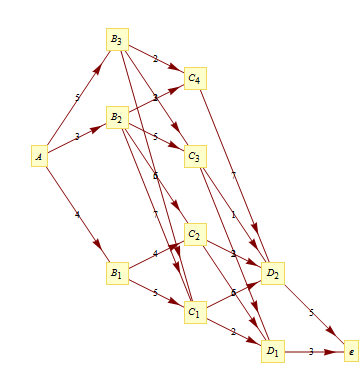
若想把D1、D2位置提升,只需加上其坐标即可~
此程序巧妙地利用了绘制树的函数,一句代码就搞定了动态决策图~
Jul 10, 2011 09:44:47 PM
呀,不错~